

Key takeaways
- In most metropolitan areas, the vast majority of flexible workers are drivers.
- These workers commute an average of at least 10 miles each way as the crow flies, which is even longer in practice.
- These results hint at the economic gains from improving public transport, especially in areas like Toronto and Denver, where workers have canceled shifts disproportionately because of issues using mass transit.
Tomorrow is Earth Day, and we at Instawork have been thinking about the impact of flexible work on the environment. By offering the Pros on our platform a choice of shifts at a multitude of businesses, we hope to cut the time and cost incurred to arrive at each workplace. The environment also benefits when workers have shorter commuting distances and can use mass transit. But some metro areas seem better suited to these considerations than others.
To begin, the chart below shows the average distance between workers' homes and the locations of their shifts in selected regions across the United States and Canada. Workers won't always commute from home, but this measure is a reasonable proxy for commuting distances. The bars are color-coded by the share of Professionals who have a driving license and a vehicle.

Not surprisingly, all the metro areas with lower shares of drivers also have some of the shortest commuting distances. On the flip side are Detroit, Los Angeles, and the Bay Area, sprawling metro areas with high shares of drivers the longest commuting distances.
Increased carbon dioxide emissions
Yet Las Vegas, whose public transportation system has been called the worst in the nation, has the shortest commuting distances of all. This is because of the way the metro area is organized. The entire area is only about 20 miles across, and the biggest workplaces – the casinos – are all centrally located on the legendary Strip. So the vast majority of workers will have commutes shorter than 10 miles, which is essentially the radius from the center. When it comes to shortening commutes, the organization of a metro area matters.
To get an idea of the impact of Las Vegas's short commutes, compare them to commutes in Austin, which has a workforce of similar size. In Las Vegas, there are about 1.1 million people in the workforce. If half of them are hourly workers (and it's probably more), then we might expect 550,000 people to be commuting every day. But in Austin, they'd have about 10 miles further to go in each direction.
In both metro areas, they'd be likely to commute by car, which produces about 400 mg of carbon dioxide per mile. Over 200 working days in a year, the extra 10 miles each way would add almost 900,000 metric tons of carbon dioxide to the atmosphere – an amount equivalent to the emissions from energy used by more than 100,000 homes in a year.
Commuting distance by industry
Does commuting distance vary by industry? We can separate shifts that are likely to be in central business districts – for catering, restaurants, and venues – from those that may be on the outskirts of a city, in large warehouses. Perhaps surprisingly, there's very little difference... except in Columbus, where commuting distances are short for hospitality shifts and still very long for transportation and logistics.
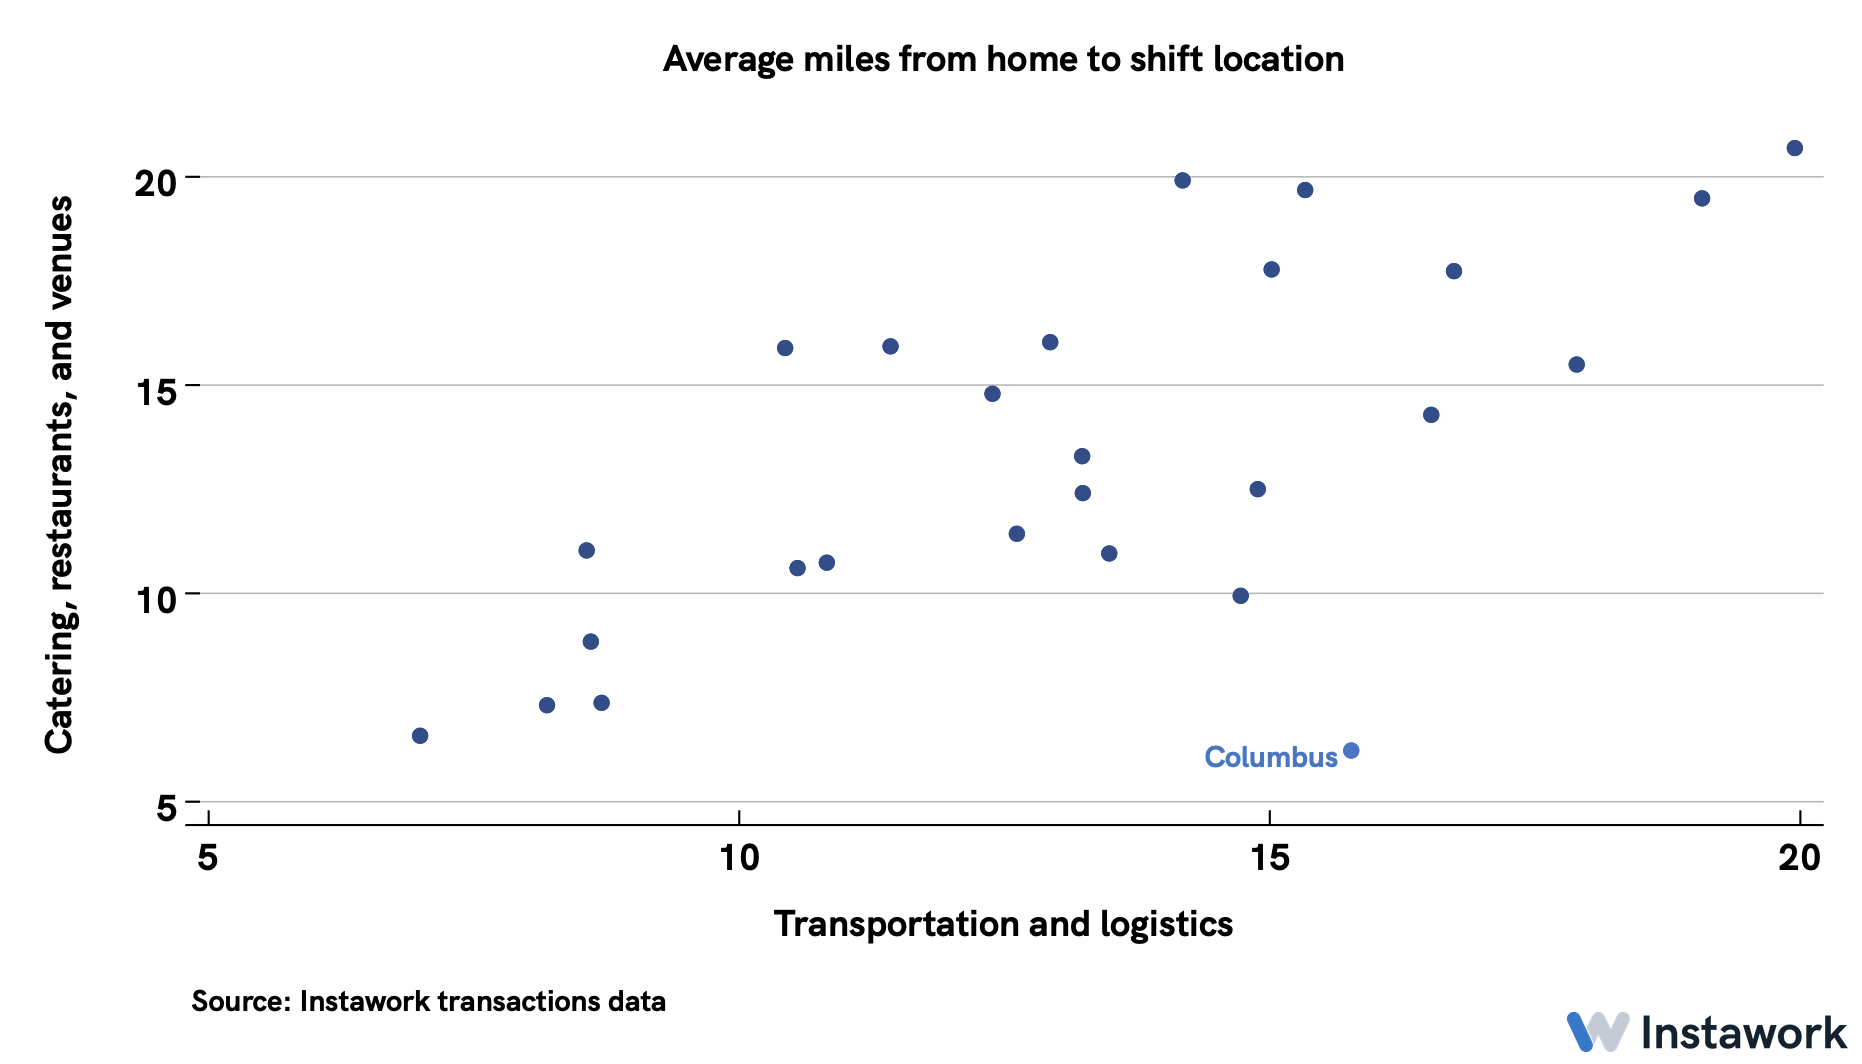
But again, Columbus is a metro area about 20 miles wide where the downtown area is right in the center, while the area's many fulfillment centers and warehouses are dotted around the periphery. This contrasts with Detroit, Los Angeles, and the Bay Area, where each of the main urban centers is on the edge of the metro area.
Performance of mass transit systems
As a final piece of analysis, we tried to gauge the performance of mass transit systems in a novel way, by looking at the ratio of shift cancellations due to public transportation versus shift cancellations due to car trouble:

In general, metro areas with more drivers had lower ratios, hence the overall downward slope of the data in the chart. In places with fewer drivers, mass transit seemed like a more important factor in arriving for shifts.
But Denver and especially Toronto were outliers, with higher ratios than we might have expected given their populations of drivers. We might ask if their mass transit systems are just not working very well, or if people have cars and use mass transit anyway. Toronto supposedly has one of the best public transportation systems in North America, but Denver's may not be fit for purpose. Do these cities need to take another look at how they're serving in-person hourly workers, who make up such a huge share of the labor force and often rely on mass transit?
Realtime metrics
These metrics, derived from data aggregated across the Instawork platform, compare the two weeks starting 4/7/2022 to the previous two weeks. To control for the overall growth of the Instawork marketplace, only shifts involving businesses that booked shifts in both periods are included:
- $0.56 rise in hourly pay
- 2.3% point drop in share of short-notice shifts
- 1.7 hours drop in hours per existing worker
To receive future report briefings or data insights from our Economic Research team, please subscribe below.
Don't forget to share this post!


