

Every day, the Instawork platform handles thousands of transactions involving businesses and hourly professionals, generating a huge amount of data on hourly pay as well as other aspects of the labor market. This report summarizes some of the major trends in demographics, roles, and worker constraints in regions across the United States.
Key Points
- Pay was stable or slightly rising in roles across the economy in July, with increases of 2% to 3% in hospitality leading the way.
- Businesses are trying hard to constrain pay going into August 2022, especially in hospitality.
- Warehouses expanded their use of flexible work at the intermediate level and pulled back at the entry level, likely reflecting expectations of lower demand and smaller staffs.
- The share of Black/African-American workers in the flexible labor pool rose for the fifth straight month.
To receive future economic insights from the Instawork Economic Research Division, please subscribe by visiting: https://hubs.li/Q012kZ--0
The data are also compiled into the Instawork Pay Signal Index (PSI) and indexed trends in hourly pay. Because businesses can book shifts in advance on the Instawork platform, the metrics include forward-looking data for the current month as well. Please refer to the appendix for explanations of the methods behind each metric.

Recent growth in flexible work
Because flexible work is one of several options that workers might have in the labor market, increases in flexible work may mean decreases in other areas. The following statistics measure differences in shift work booked on the Instawork platform (measured in hours), month over month:
Regions with the highest growth of flexible workRegions with the lowest growth of flexible work1. Boston, MA1. Atlanta, GA2. Denver, CO2. Baltimore, MD3. Las Vegas, NV3. Dallas, TX4. Miami, FL4. New York, NYRoles with the highest growth of flexible workRoles with the lowest growth of flexible work1. Counter staff / cashier1. Concession / stand worker2. Warehouse associate - intermediate2. Warehouse associate - entry level3. Dishwasher3. Event server4. Runner4. General labor
Technical note: To control for the growth of the Instawork platform, only business locations that have participated for at least two months before the start of the comparison period are included. Changes in hours are included only for roles for which businesses booked shifts during both months.
Demographics of flexible workers


Pay Signal Index


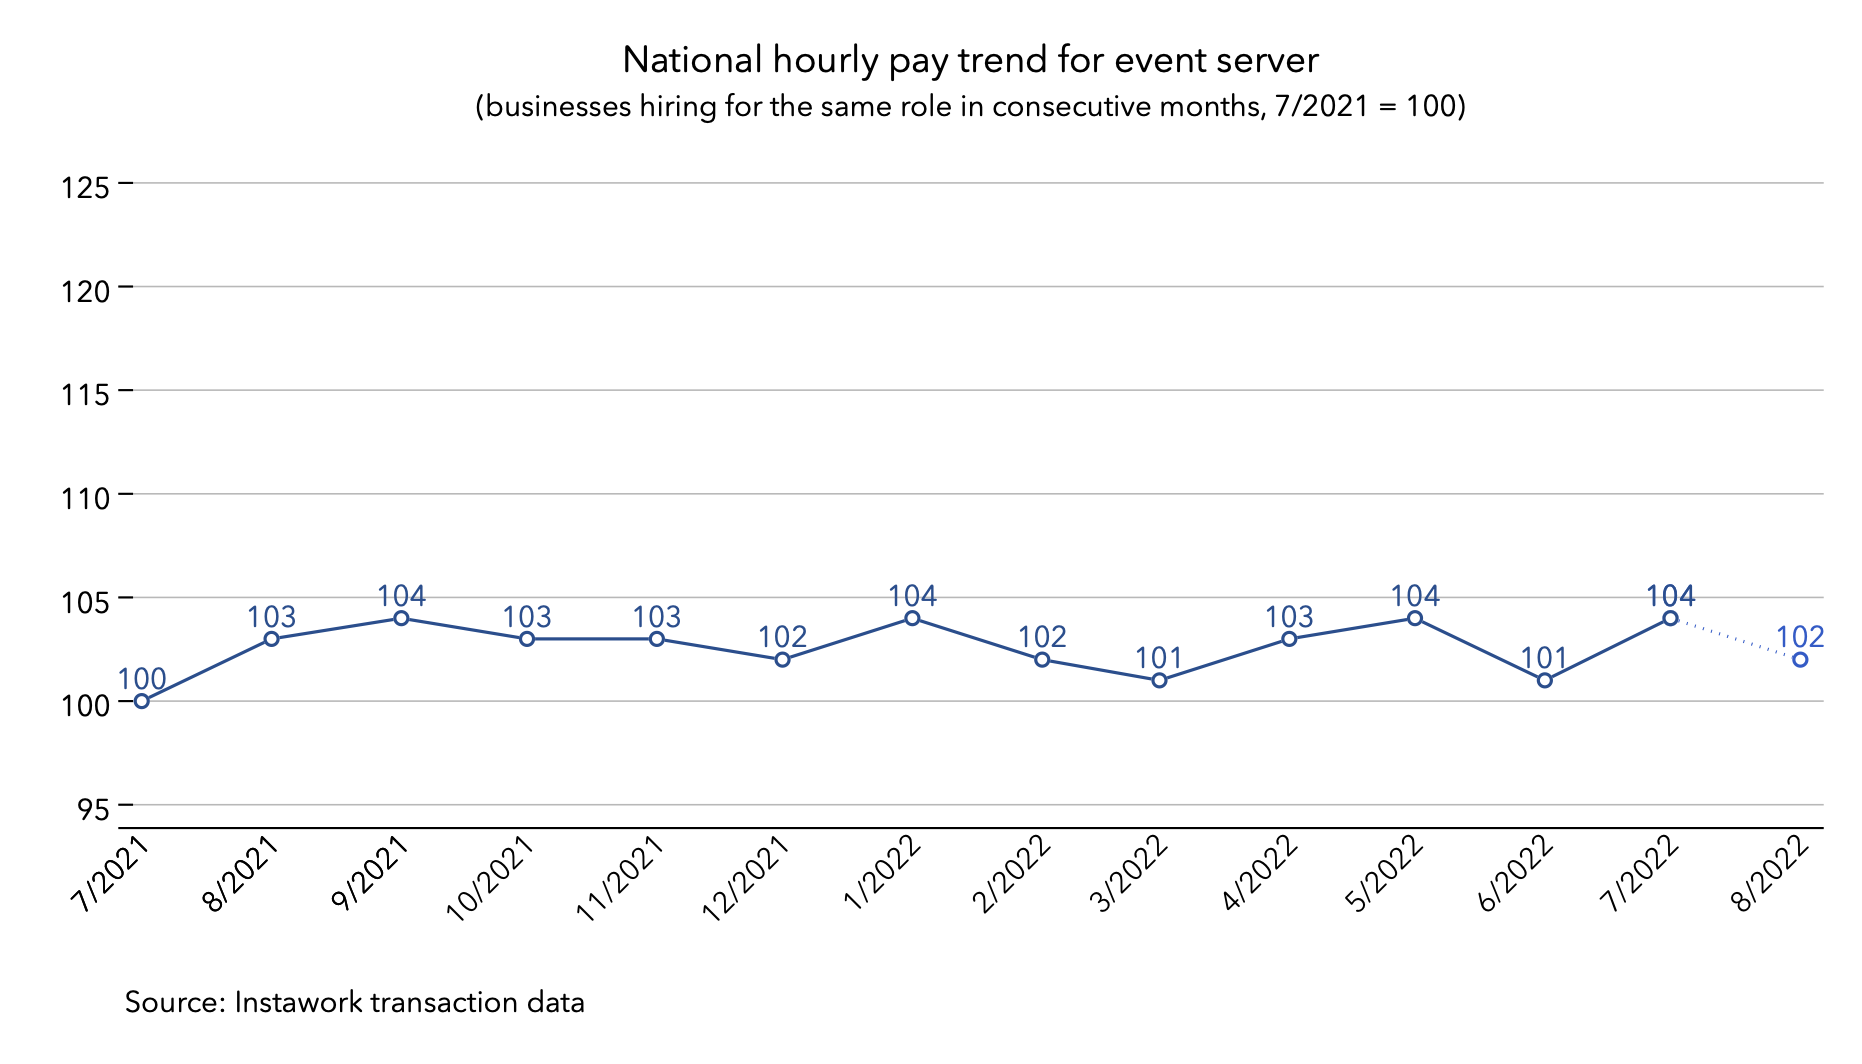
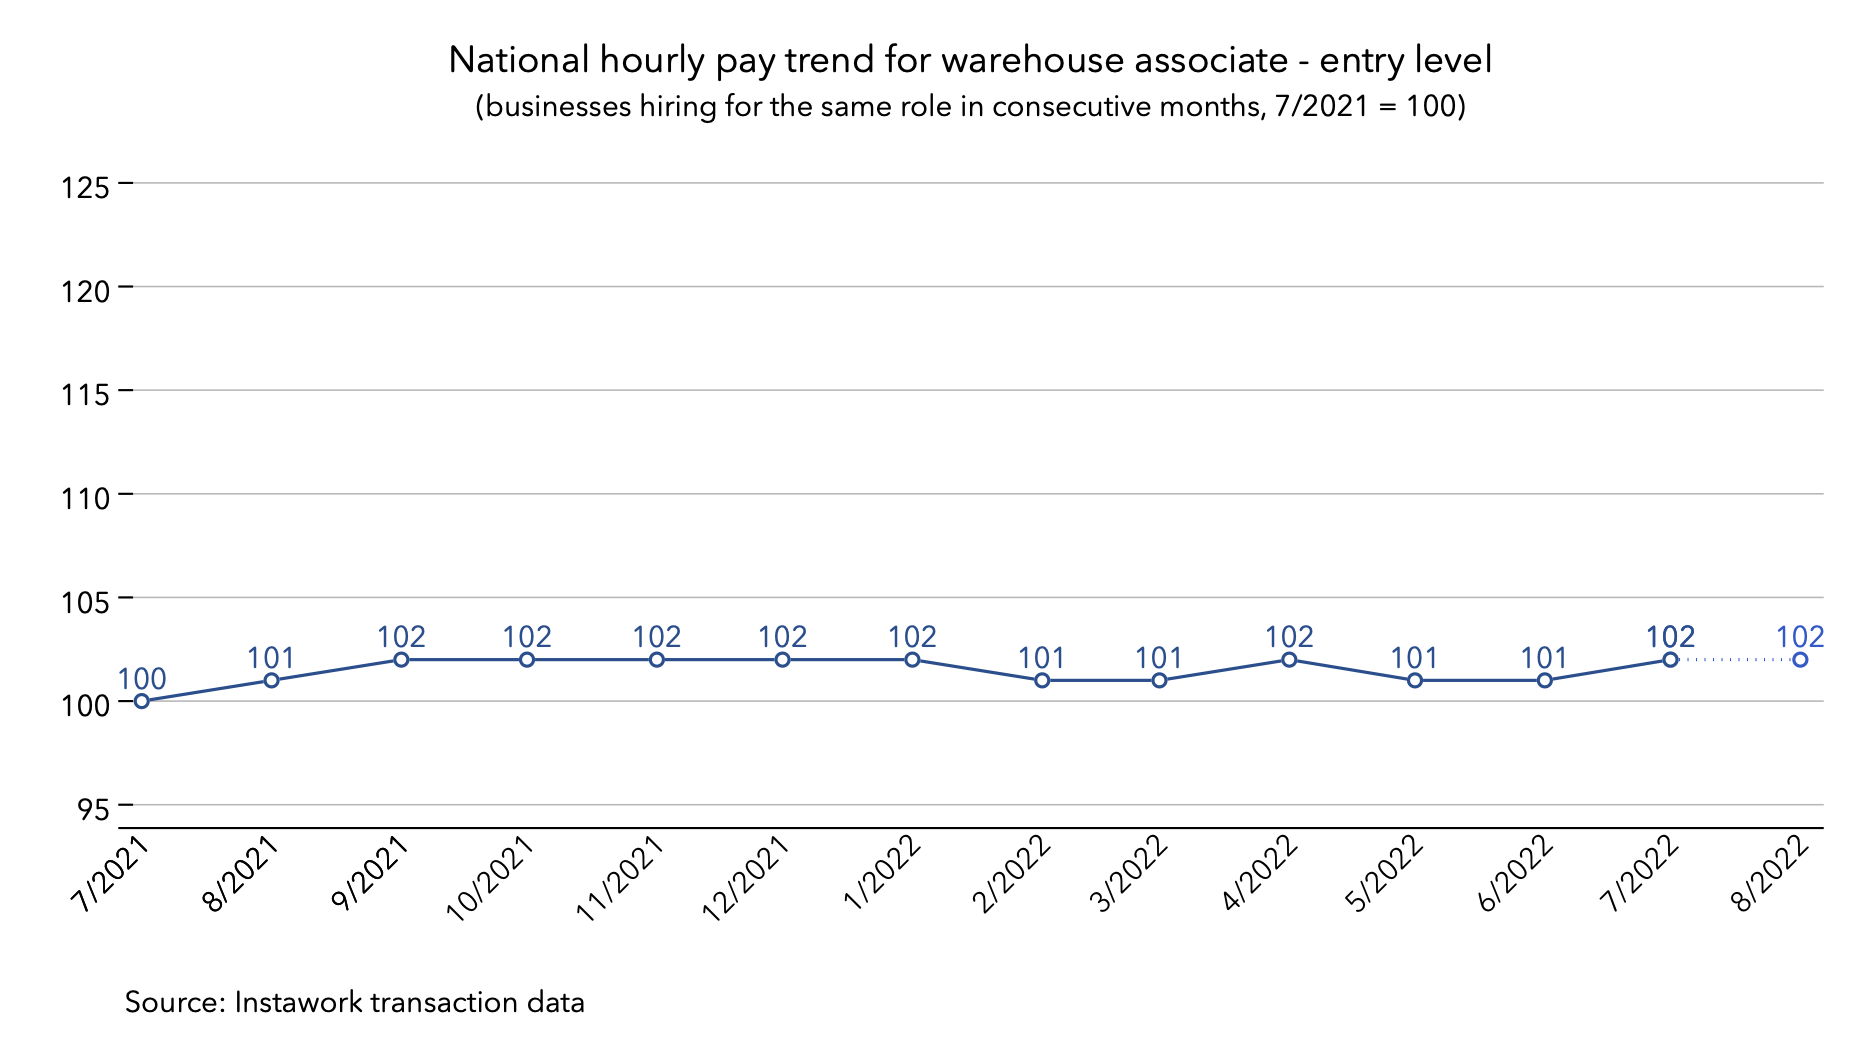
Indexed trends in hourly pay


To receive future report briefings or data insights from our Economic Research team, please subscribe below.
Methodological Appendix
Instawork PSI (Pay Signal Index)
The PSI gauges the overall direction of changes in hourly pay from month to month, much the way a purchasing managers’ index measures supply chain activity.
To begin, for each month, we measure the average hourly pay offered by each business on our platform for each role in each region. If the business offered shifts for the same role in the same region during the previous month, we record whether the average rose or fell. A rise is recorded as +1, a fall as -1, and no change as 0.
Next we weight this signal by the average number of shifts the business offered for that role across the two months. For example, if the business offered 10 shifts for line cooks in the Houston area during February and 18 shifts for the same role in the same region during March, then the weight would be 14.
We group these weighted signals by the Census Bureau’s occupational categories and take the weighted average for each category. Then we multiply the weighted average by 50 and add it to 50. This yields a PSI between 0 and 100. At 0, the PSI implies that all businesses in the sample offered lower pay. At a PSI of 100, all businesses offered higher pay. At a PSI of 50, businesses that raised or lowered pay did so with equal weight (or loosely, equal numbers of shifts).
At present we cover six major occupational categories. These are the numbers of workers they represented in the Bureau of Labor Statistics’ counts of hourly workers in 2021, and their shares of the total reported number of hourly workers:

To create a national PSI, we calculate a weighted average by weighting the PSI for each occupational category by its share of hourly workers above. The resulting national PSI represents occupational categories that cover roughly 44% of hourly workers in the American labor force.
Indexed trends in hourly pay
Sample selection for our pay trends is similar to the method for the PSI. Businesses that book shifts for the same role in the same region during consecutive months are the units of observation. For each pair of months, we calculate the change in the average hourly pay offered for the given role in the given region. Examples of roles are line cooks, forklift drivers, and custodial staff.
Next, as for the PSI, we weight the changes in pay by the average number of shifts across the two months. Then we calculate a weighted average of the changes at a national level for each role. To create an indexed trend, we have chosen July 2021 as the starting point, where the indexed hourly pay for each role is set to 100. We then use the monthly changes to map the trend from August 2021 onward.
At present we publish the indexed trends in hourly pay for 14 of the roles staffed on our platform:

Don't forget to share this post!


