

Every day, the Instawork platform handles thousands of transactions involving businesses and hourly professionals, generating a huge amount of data on hourly pay as well as other aspects of the labor market. This report summarizes some of the major trends in demographics, roles, and worker constraints in regions across the United States.
Key points
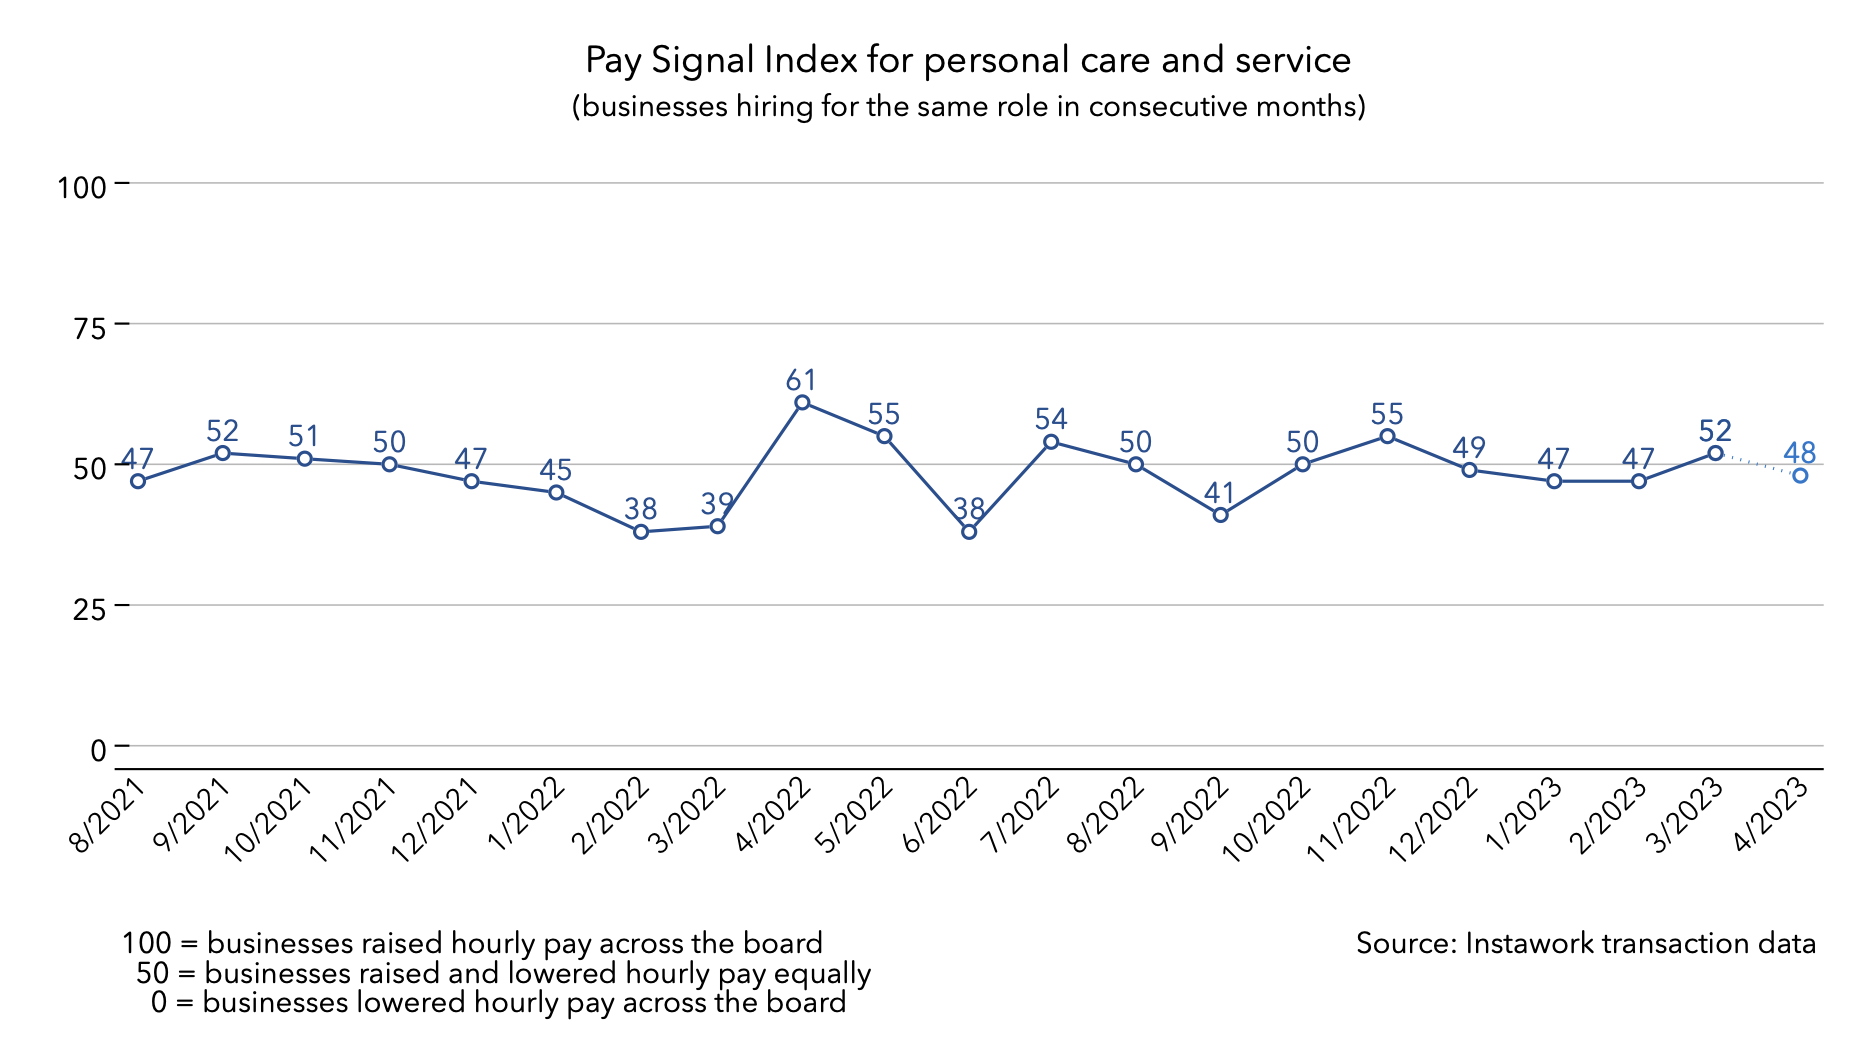
- Pay for most roles was steady in March, but businesses were still slightly more likely to raise pay than lower it.
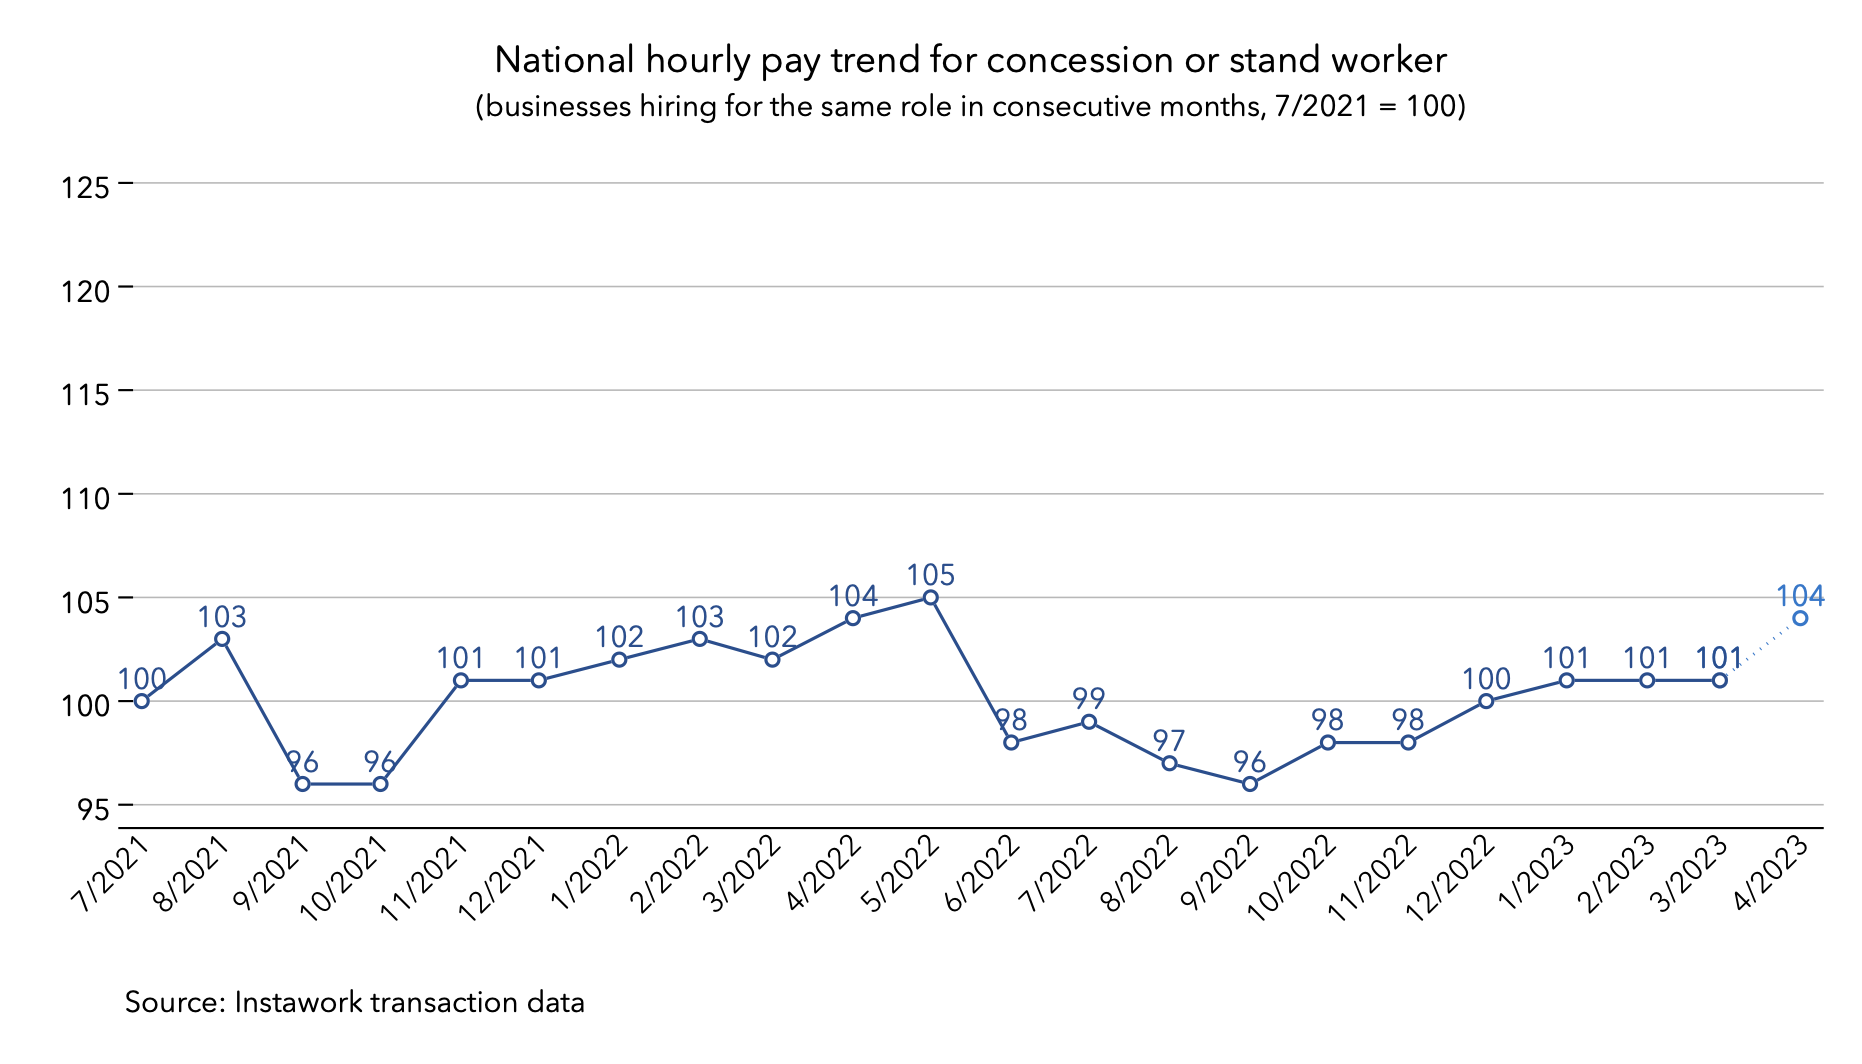
- In April, we anticipate a 3% increase in hourly pay for concession and stand workers as baseball season gets underway.
- In our new in-app survey data, workers say a fair hourly pay rate exceeds the living wage in most markets.
The data are also compiled into the Instawork Pay Signal Index (PSI) and indexed trends in hourly pay. Because businesses can book shifts in advance on the Instawork platform, the metrics include forward-looking data for the current month as well. Please refer to the appendix for explanations of the methods behind each metric.
In March, a preponderance of businesses raised hourly pay for flexible workers, despite lower offers heading into the month:

In-app survey data
This month we are introducing a new section of the report based on data from surveys delivered via the Instawork Pro app. For details on methods and questionnaires, please see the Methodological Appendix below.
These surveys track Pros' labor market situations on a monthly basis. Here is the distribution of Pros by the hours they worked in all jobs during the reference week (20 March 2023) versus the hours they would have preferred to work:

As we reported last week using earlier survey data, Pros want more hours. In fact, more than half of them said they wanted to work more than 40 hours per week, but only a third of them actually did. Here is a similar breakdown for the types of jobs they worked in the reference week:

Almost half of surveyed Pros said they had a full-time job, but many more wanted one. The numbers were very similar for part-time jobs. By contrast, the share of Pros looking to work Instawork shifts was only slightly larger than the share who said they would work shifts during the reference week. Very few Pros said they did not want to work at all.
Each month the surveys will include an additional one-off question on a separate topic. This month, the question was, "What is a fair hourly rate for an easy shift close to your home?" Here are the responses for our selection of our biggest markets. The "fair pay rate" was averaged among the respondents in each market and compared with the average hourly rate earned by Pros in March and the MIT Living Wage for a single person with no children:

It is important to keep in mind that the Instawork average hourly rate in each market depends on the local mix of roles and industries. Generally, the average is close to the MIT Living Wage. But in many cases, Pros believe a fair pay rate would exceed both numbers. The gaps are particularly large in the Philadelphia, Chicago, Miami, and Seattle metro areas. By contrast, the average Instawork rate exceeds both the average fair pay rate and the MIT Living wage in Minneapolis and Los Angeles.
Recent growth in flexible work
Because flexible work is one of several options that workers might have in the labor market, increases in flexible work may mean decreases in other areas. The following statistics measure differences in shift work booked on the Instawork platform (measured in hours), month over month:
Regions with the highest growth of flexible workRegions with the lowest growth of flexible work1. Houston, TX1. Providence, RI2. Las Vegas, NV2. Dallas, TX3. Nashville, TN3. Los Angeles, CA4. Phoenix, AZ4. Atlanta, GARoles with the highest growth of flexible workRoles with the lowest growth of flexible work1. Merchandiser1. Brand ambassador2. Counter staff / cashier2. Custodial3. Runner3. Warehouse associate – intermediate4. Event server4. Line cookGrowth of flexible work was strongest in entertainment and logistics hubs, with corresponding increases in shift volumes for related roles. Meanwhile, roles that have seen recent increases in hourly rates – especially custodial and intermediate warehouse work – saw relatively lower demand.
Technical note: To control for the growth of the Instawork platform, only business locations that have participated for at least two months before the start of the comparison period are included. Changes in hours are included only for roles for which businesses booked shifts during both months.
Demographics of flexible workers
The share of men working shifts on the platform fell significantly for the first time since August 2022, while the share of white workers rose for the ninth month straight. The fact that white workers, who typically have lower unemployment rates than Black/African-American and Hispanic/Latino workers, are increasingly accessing flexible work suggests that the overall labor market is cooling.


Pay Signal Index
Slightly more businesses raised pay than lowered pay in every occupational group we track during March. Pay offers bounced back in building and grounds cleaning, ticked up strongly in production, and continued a three-month streak of higher rates in transportation and material moving:


Indexed trends in hourly pay
Hourly pay was steady in most roles in March, with decreases in a couple of hospitality positions. Pay for custodial work resumed its long-term upward trend. In April, we anticipate an increase of 3% in hourly pay for concession and stand workers as the baseball season gets underway:


To receive future report briefings or data insights from our Economic Research team, please subscribe below.
Methodological Appendix
Instawork in-app surveys
Five surveys per month are delivered via the Instawork Pro app. Random samples of Pros who have worked at least one shift in the past 12 months may be shown a one-question survey when they open the details for a shift. No Pro receives more than one survey per month. The surveys continue until they collect 1,000 responses.
The repeating questions on Pros' labor market situations are as follows:
1. Please mark all the kinds of work you will do this week:
- regular full-time job
- regular part-time job
- shifts booked on Instawork
- other app-based or temporary work
- no work
2. Please mark all the kinds of work you would like to do each week:
- regular full-time job
- regular part-time job
- shifts booked on Instawork
- other app-based or temporary work
- no work
3. In total, how many hours will you work this week at all your jobs?
- 0-10
- 11-20
- 21-30
- 31-40
- 41-50
- 51 or more
4. In total, how many hours would you like to work each week at all your jobs?
- 0-10
- 11-20
- 21-30
- 31-40
- 41-50
- 51 or more
Instawork PSI (Pay Signal Index)
The PSI gauges the overall direction of changes in hourly pay from month to month, much the way a purchasing managers’ index measures supply chain activity.
To begin, for each month, we measure the average hourly pay offered by each business on our platform for each role in each region. If the business offered shifts for the same role in the same region during the previous month, we record whether the average rose or fell. A rise is recorded as +1, a fall as -1, and no change as 0.
Next we weight this signal by the average number of shifts the business offered for that role across the two months. For example, if the business offered 10 shifts for line cooks in the Houston area during February and 18 shifts for the same role in the same region during March, then the weight would be 14.
We group these weighted signals by the Census Bureau’s occupational categories and take the weighted average for each category. Then we multiply the weighted average by 50 and add it to 50. This yields a PSI between 0 and 100. At 0, the PSI implies that all businesses in the sample offered lower pay. At a PSI of 100, all businesses offered higher pay. At a PSI of 50, businesses that raised or lowered pay did so with equal weight (or loosely, equal numbers of shifts).
At present we cover six major occupational categories. These are the numbers of workers they represented in the Bureau of Labor Statistics’ counts of hourly workers in 2021, and their shares of the total reported number of hourly workers:

To create a national PSI, we calculate a weighted average by weighting the PSI for each occupational category by its share of hourly workers above. The resulting national PSI represents occupational categories that cover roughly 44% of hourly workers in the American labor force.
Indexed trends in hourly pay
Sample selection for our pay trends is similar to the method for the PSI. Businesses that book shifts for the same role in the same region during consecutive months are the units of observation. For each pair of months, we calculate the change in the average hourly pay offered for the given role in the given region. Examples of roles are line cooks, forklift drivers, and custodial staff.
Next, as for the PSI, we weight the changes in pay by the average number of shifts across the two months. Then we calculate a weighted average of the changes at a national level for each role. To create an indexed trend, we have chosen July 2021 as the starting point, where the indexed hourly pay for each role is set to 100. We then use the monthly changes to map the trend from August 2021 onward.
At present we publish the indexed trends in hourly pay for 14 of the roles staffed on our platform:

Don't forget to share this post!


