Key takeaways
- Flexible workers are mobile, and a significant share of them cross state lines to work
- Major metropolitan areas in the Northeast have started to recoup flexible workers
- Rising pay against a backdrop of high inflation may be motivating the trend
A central finding in our inaugural State of the Hourly Workforce report is that flexible workers have shown a high degree of mobility. In our survey of Instawork's flexible workers, 62% of respondents said they would relocate to a place with more opportunities for work. So far this year, roughly 7% of Pros who have been active on the platform for at least six months have worked in multiple regions.
Generally speaking, Pro migration has followed similar patterns to the migration of hourly workers overall. In the early part of the pandemic, thousands of people migrated south and west. They were often leaving major metropolitan areas to seek lower prices, warmer temperatures, proximity to family, and fewer restrictions related to public health. Even within these regions, people moved to more suburban climes, for example from the Los Angeles area to the Inland Empire.
We have been tracking the migration patterns of our Pros over the course of this year, as the pandemic's effects have waned and consumers have shifted their spending into leisure, hospitality, and travel. Many Pros move around within their states, especially within California – a huge state where several major metropolitan areas are within driving distance of each other. But some Pros actually cross state lines, suggesting more of a permanent migration.
Top destinations for Pros
In the first two months of the this year, the top destinations for Pros with at least six months of activity on our platform who crossed state lines were these:
DestinationShare of total interstate migrations for flexible workWashington, D.C.19%Baltimore, MD15Los Angeles, CA8Providence, RI8Bay Area, CA6
Once again, moves from Washington to Baltimore (and vice-versa) may not represent true migrations but rather just long commutes. The same could be true for Pros going to Providence from, say, Boston. Moves to Los Angeles and the Bay Area from out of state are much more likely to have been true migrations.
Either way, the most popular destinations changed over the course of the year. By the spring, the major metropolitan areas in the Northeast of the United States were firmly in the lead. Here are the numbers from May and June:
DestinationShare of total interstate migrations for flexible workNew York, NY12%Philadelphia, PA12Washington, D.C.9Baltimore, MD8Boston, MA6
To be sure, a Pro living equidistant from New York and Philadelphia would only have an hourlong commute in each direction. But most of our Pros live much closer to the centers of their respective metros.
Right behind these five was the Chicago area, which has been losing population for several years. It looks like some of the people who left these areas may be coming back, or possibly that labor shortages caused by emigration are pushing up wages and luring new workers into these cities.
In the fall, the Northeastern metros have continued to lead the way, but their overall dominance has also declined. In September and October, these were the top interstate destinations:
DestinationShare of total interstate migrations for flexible workPhiladelphia, PA12%New York, NY8Trenton, NJ5Baltimore, MD5Providence, RI5
Inflation and pay rates play a role
Pay may be rising in importance, given the backdrop of high inflation. Since January, the average hourly pay for Pros on our platform has risen by 17% in the Philadelphia area, 15% in New York, 12% in Chicago, and 7% in Baltimore. Some of these increases may come from changes in the mix of roles listed for shifts, but they still represent the overall economic opportunities available in flexible work.
In the larger picture, the pandemic-era trends in migration may be on the wane. The big winner for migrations on our platform this year has been New York, which quintupled its share of migrations, followed by Chicago and Detroit. The destinations that lost the most popularity were Charleston, Washington, D.C., Baltimore, Tampa, Phoenix, and several metros in California.
The data also show a growing diffusion of destinations as the year progresses. A Herfindahl-Hirschman Index for the concentration of migration destinations was 0.088 in January and February. By September and October, it had fallen by almost half to 0.046. This means that flexible workers were fanning out across the country, and not just to sunnier regions.
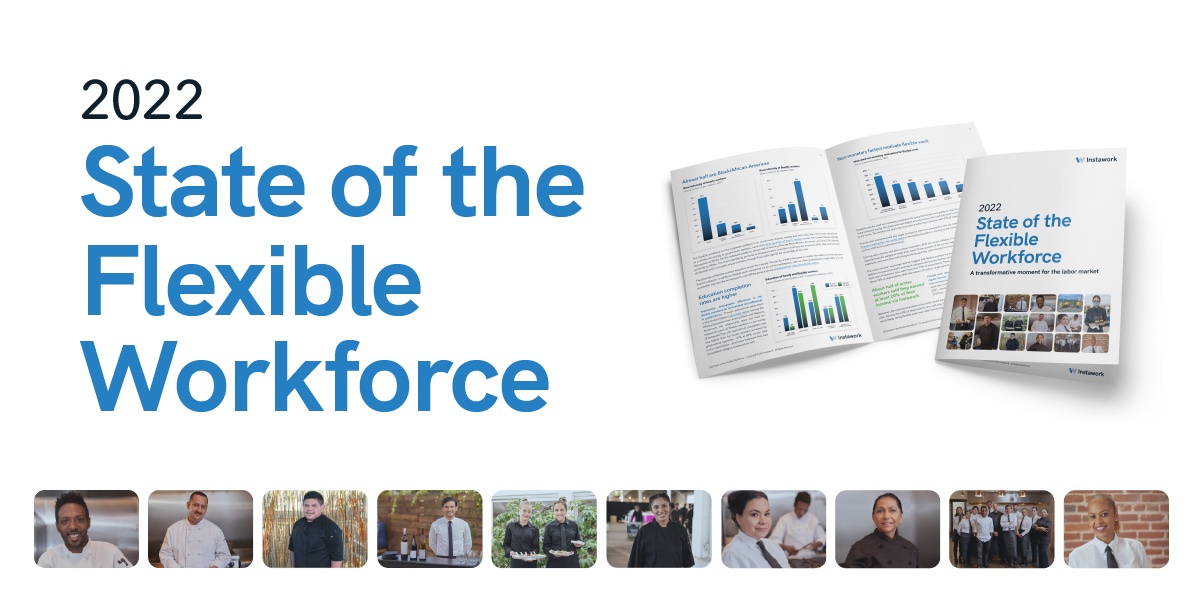
Our report has much more information about the supply, demand, and behavior of flexible workers. We'll continue to offer deeper dives on its topics in the months to come.
Realtime metrics
These metrics, derived from data aggregated across the Instawork platform, compare the two weeks starting 10/20/2022 to the previous two weeks. To control for the overall growth of the Instawork marketplace, only shifts involving businesses that booked shifts in both periods are included:
- $0.11 drop in hourly pay
- 0.5% point drop in share of short-notice shifts
- 0.9 hours rise in hours per existing worker
To receive future briefings and data insights from our Economic Research team, please subscribe below. Follow Daniel Altman on Twitter at @AltmanEcon or on LinkedIn.


